

See what the data suggests about any Texas property before you buy, build, or drill.
A property in Fredericksburg. A decision in minutes.
You're walking 40 acres outside Fredericksburg with a client. Before the offer goes in, you type the address into Texas Well Water Map.
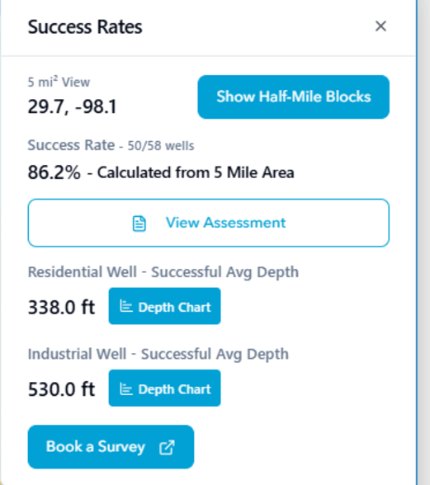
The site is near Luckenbach, and the map shows a 5-mile area near the property has a 78% drilling success rate — meaning 78% of wells drilled in that area pump more than 5 gallons per minute for more than 8 hours. It also means 22% of drilling projects in that area don't succeed.
Scale it down to half a mile. The map shows the depths of successful wells nearby, which helps you budget for the cost of a new well before the offer goes in.
You don't need a clean address to start. Search by street address, GPS coordinates, Property ID / APN, or well number - whichever identifier you already have in hand.
Five miles is a region. Half a mile is a property. Either way, you walk into the conversation with the data the area has on record — not a guess.

From the County View to a Specific Address
Start broad with the regional pattern across Texas, then zoom into the data the area has on record for any address.

Start with the county picture
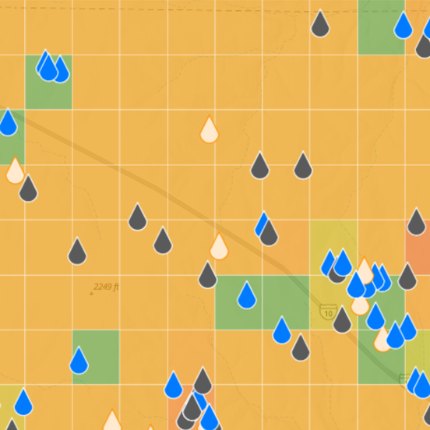
Heat maps across all 254 Texas counties show where drilling success has clustered historically — and where the patterns suggest more caution.

Zoom into the area
At 5-mile resolution, see expected well depths, the success rate for the region, and how outcomes from nearby drilled wells are distributed.

Search four ways
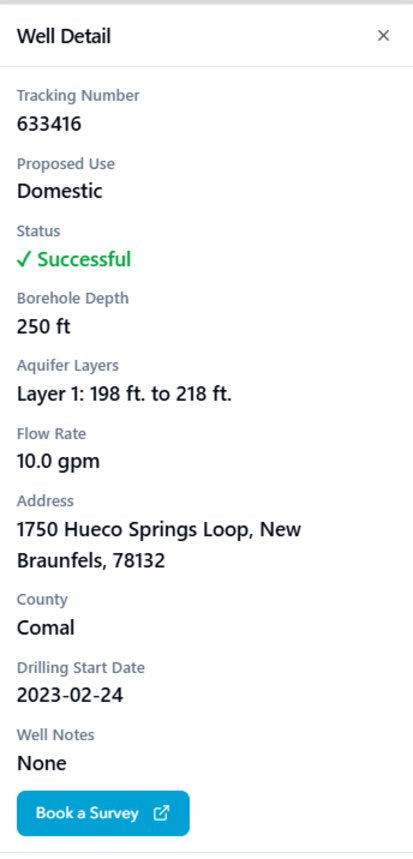
Street address, GPS coordinates, Property ID / APN, or well number. The geoblock data sidebar shows the area's pattern - what the historical record says about depth, success, and drilling outcomes nearby.
Watch Quick Demos
Evaluating a rural property before purchase
A residential water well decision on rural land near Fredericksburg, TX. What the 5 mi² geoblock data tells you before the offer goes in.
Finding regions that support high-volume wells
Scanning Texas for areas where the data suggests strong potential for 75+ gallon-per-minute wells.
Drill-site planning near Spicewood, TX
Pulling nearby well records and depth patterns to inform a drilling plan in the Spicewood area.



Four Ways to Search
Properties can be found by any of the following:
Street address
1234 County Road 200, Fredericksburg, TX
GPS coordinates
Decimal Degrees - 30.2672, -97.7431
Degrees, Minutes, Seconds - 30°16'02"N, 97°44'35"W
Property ID / APN
The parcel identifier from the county appraisal district
Well number
The identifier from a water well report
Rural addresses are often incomplete or shared across parcels. If the address doesn't pull the property you want, the Property ID or a well number will.
How the Data Works
Texas Well Water Map combines two data sources into one view: 3,800+ proprietary on-site surveys conducted by Well Water Finders using patented groundwater detection equipment, and historical drilled-well records (depth and yield only).
Together they produce the heat maps, geoblock success rates, and — at the Premium tier — Well Water Finders' own outcome labels on individual drilled wells.
Three Ways to Use the Map
Free - $0
Heat maps across all 254 Texas counties. A county-level read on where drilling success has historically clustered.
Paid - $14.99/month
Everything in Free, plus search any Texas property - by address, coordinates, Property ID / APN, or well number - and zoom to a 5-mile block, success rates and typical residential/industrial depths, generate drilling assessments: a data-backed read on the odds before you drill.
Paid subscribers also get a $5 discount off of every Texas Property Water Profile report.
Premium - $29.99/month
Everything in Paid, plus sharpen to a half-mile block - 100x the detail of Paid. Individual drilled-well records with Well Water Finders outcome labels, and higher usage limits.
Premium subscribers also get priority scheduling and 10% off Well Water Finders on-site surveys (a minimum $200 value).
Just need the records for one address?
The map is a subscription for browsing patterns across Texas. For a single property, the Texas Property Water Profile pulls one downloadable report - the Groundwater Conservation District, wells on record, and ownership details, plus the area's well-success patterns. Built for the new Seller's Disclosure (TREC Form 61-0), it helps sellers answer the groundwater questions and gives buyers a read on the area's water before the offer goes in. $24.99 per report. Paid map subscribers receive a $5 discount per report.
Also Useful for
Drillers
At Premium, individual drilled-well records and Well Water Finders outcome labels help inform quoting precision and equipment planning.
Groundwater Conservation Districts
½-mile resolution and individual well records support aquifer recharge planning, well monitoring, and watershed-scale work.
Site Selectors
Statewide heat maps scan quickly. Address Search drills into candidate sites for facility and utility groundwater vetting.
Groundwater Data Across All 254 Texas Counties
Coverage includes high-growth areas like Travis County, Williamson County, and Hays County, alongside rural regions across West Texas, East Texas, and the Hill Country.
Whether you're evaluating land near Austin, San Antonio, Dallas, Fort Worth, or in more remote parts of the state, Texas Well Water Map gives you the historical pattern the area has on record — before you commit.
FAQs
The Texas Well Water Map combines historical well records, mapping tools, and proprietary site data to show what the data suggests about groundwater patterns in an area. Well Water Finders builds Texas-specific groundwater intelligence on 3,800+ on-site surveys and historical drilled-well records and then layers heat maps, geoblock success rates, and assessments on top.
The TCEQ viewer shows drilled-well report locations from public records. Texas Well Water Map combines those records with 3,800+ Well Water Finders on-site surveys, then turns the combined dataset into heat maps, geoblock success rates, depth histograms, and outcome labels on individual wells (at the Premium tier). The public records are one input; the analysis is what Well Water Finders adds.
Yes. The map accepts four inputs: street address, GPS coordinates, Property ID / APN from the county appraisal district, or a well number from a water well report. Rural properties often have incomplete or shared addresses, so the Property ID and well-number options are frequently the faster route.
Each 5 mi² geoblock summarizes the well outcomes recorded inside it including success rate, residential and industrial well depths, and a histogram of how depths are distributed across nearby wells. It's a regional read, not a property-specific prediction. Five miles is a region; half a mile (Premium) is closer to a property.
Currently across all 254 Texas counties, where Well Water Finders' data is most comprehensive. Additional regions will be posted soon.
Heat maps and geoblock summaries reflect the patterns in the historical record. The area groundwater assessment is a read
on the area’s groundwater patterns - what nearby wells have found, how deep they tended to go, and how outcomes are spread across the area. Drilling outcomes depend on local geology, groundwater availability, equipment, and pure local variation. The map informs your decision; it doesn't make the decision for you.
No. The map and Address Search work on their own subscriptions. A Well Water Finders survey is a separate service — a physical, on-site visit at your property using our patented groundwater detection equipment. Most users start with the map and book a survey only when they want ground-truth data for a specific decision.